What current wildfire activity tells us about the changing relationship between fire behavior, exposure, and financial loss.
California · United States · Europe & Global | Data through 29 July 2026
Contents
Wildfire has decoupled from burned area
Wildfire acreage and financial loss are no longer moving together.
In 2025, global burned area was the second lowest since 2002, yet wildfires produced a record $40–41 billion in insured losses. In 2026, the pattern has reversed: U.S. acreage is sharply higher, Europe is burning at nearly three times its seasonal norm, but global fire activity and first-half insured losses remain comparatively low.
The decisive factors are not simply how many acres burn, but where fires occur, how quickly they spread and how much property lies in their path. It is this relationship between fire behavior and exposure that sits at the center of KatRisk’s work with Technosylva, combining catastrophe modeling with operational wildfire science to better understand where fire becomes financial loss.
GLOBAL BURNED AREA YTD
106M ha
below 182.5M ha 24yr avg
U.S. ACRES YTD
+50.8%
vs same period 2025
EUROPE BURNT AREA
2.8x
vs 20yr seasonal norm
2025 INSURED LOSS
$40-41bn
costliest wildfire year on record
Fire Speed vs Home Loss
2.7% of fires grow faster than 4,003 acres per day
88% of homes destroyed come from those fast fires
Fires growing faster than 4,003 acres a day are just 2.7% of all fires, but cause 88% of home destruction. The fastest fires have grown 250% faster over two decades, mostly in grass and shrub.
California: lower acreage, but not lower hazard
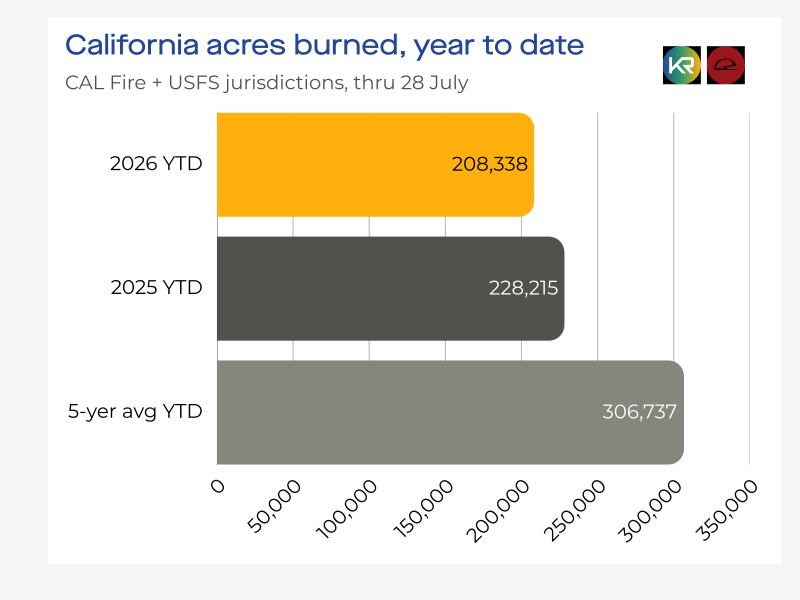
California recorded 208,338 acres burned through 28 July 2026:
Fire count was down 15.2% from 2025 and 23.5% from the five-year average. But by 20 May, California had already burned 48,135 acres — roughly twice the five-year average — before June lightning activity fell to about 4,300 strikes, versus around 7,400 normally.
💡LOWER ACREAGE, NOT LOWER HAZARD
The season's apparent moderation reflects a shortage of ignitions, not a sustained reduction in hazard.
United States: The fire geography has shifted
In 2025, a single week of January fires in Southern California produced 89% of the nation's destroyed structures for the entire year.
89%
of the year's national structure destruction
~16,264
structures destroyed
7 days
the window that produced nearly all of it
~$40bn
insured losses
The 2026 U.S. season is primarily a Great Plains and Interior West event, rather than a California-led event. Through 29 July, U.S. fires reached 43,145 (up 8.4%) and acreage hit 4.57 million (up 50.8%).
National Preparedness Level hit PL 5, versus PL 4 at the same point in 2025. Much of this burning occurred on rangeland, limiting insured losses despite the surge in acreage.
Europe: the global outlier
Europe had burned 386,242 hectares by week 29, compared with a 20-year same-period average of 138,242 hectares, approximately 2.8 times normal.
The increase was concentrated in western Europe:
💡325,000–360,000 people displaced across France and Spain in one week in late July 2026 — the largest evacuation event in modern European wildfire history.
Capital markets are moving
Wildfire is the fastest-growing peril in global catastrophe losses, with insured losses rising roughly 12% a year.
$5bn+ wildfire-exposed catastrophe bonds issued in 2026 YTD, nearing 2025's full-year record
$61bn record catastrophe bond market size after new issuance rose 45% in 2025
💡Investors increasingly view robust hazard data and catastrophe models as essential to wildfire-risk transfer. Better-understood risks attract more capacity and more favorable pricing; poorly quantified risks face a higher cost of capital.
From static hazard maps to real fire behavior
Across every region, the same disconnect shows up: acreage keeps falling or holding flat while losses concentrate wherever fire meets people and property.
A single week of fires in January 2025 produced 89% of the nation's destroyed structures for the entire year, on a small fraction of the year's total burned acreage. Acreage measured the season; it didn't measure the loss.
A static hazard map can't tell you which fires will move fast or where they'll meet the built environment. Real fire behavior can.
KatRisk’s U.S. Wildfire Model combines Technosylva’s physics-based fire-spread science with catastrophe and financial modeling, translating real-world fire behavior into insurance metrics for underwriting, pricing and portfolio management.
→ 50,000-year stochastic catalog
→ 22 million simulated fire footprints
→ 30m spread modeling grid
Here's how this year's patterns map to our Wildfire model:
This year’s pattern ↑
How the KatRisk model addresses it ↓
2.7% of fires caused 88% of home destruction
Rate of spread and flame length as primary vulnerability inputs
California's hazard didn't fall; ignitions just didn't arrive
Separate short-term and long-term hazard views
One January week caused 89% of a year's national structure loss
Urban conflagration modeling, validated against major 2025 wildfire events
As wildfire becomes less seasonal, less geographically confined and more affected by changing climate and development patterns, insurers need to move beyond static hazard maps toward dynamic, physics-based and portfolio-aware risk intelligence.
.png "Logos- landing pages (2)")
.png "Logos- landing pages (4)")

.svg "Charts - Infographic wildfire 2026 (1)")
.svg "Charts - Infographic wildfire 2026 (2)")
.svg "Charts - Infographic wildfire 2026 (3)")


.svg "Charts - Infographic wildfire 2026 (4)")
.png?width=700&height=150&name=Untitled%20design%20(11).png "Untitled design (11)")
